


Thermal Imaging
in the Investigation of Solid Masonry Structures
Maureen Young
 |
|
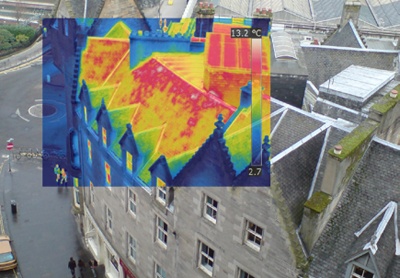
| This thermal image inset within a digital image shows temperature variations across a roof using the ‘rainbow’ colour scheme. Each colour represents a temperature, shown in the scale on the right. (All images: Historic Scotland). |
Thermal imaging (also called infrared thermography) is a type of non-destructive investigation (NDI). It allows the user to obtain data and analyse an object without the need for a sample to be removed and without damage to the object.
A wide range of non-destructive techniques is available for use in building conservation. Some are ‘active’ techniques where a signal is sent out by the instrument. Information is obtained by analysing changes in the returning signal. Examples of this kind of NDI include:
- 3D laser scanning, which maps the three-dimensional structure of objects.
- Microwave moisture analysis, where the instrument projects a beam of microwaves into a substrate and quantifies sub-surface moisture.
Other NDI techniques are ‘passive’. They do not emit a signal themselves, but are dependent on detecting some emission by the object.
- Heat flow sensors, used to determine U-value, are a form of passive NDI. They detect heat flow through a surface.
- Thermal imaging is, in the main, a passive form of NDI. It detects infrared light emitted by objects. However, some specialist forms of thermal imaging do involve active heating of surfaces, often to observe rapid heating and cooling events.
WHAT IS THERMAL IMAGING?
Thermal imaging is a method for visualising and quantifying temperature variations across surfaces. Temperature differences as low as 0.1°C can be observed. It is a rapid method allowing imaging of large surface areas. It is non-destructive and non-contact, which can be very important in some applications such as electrical inspections.
 |
||
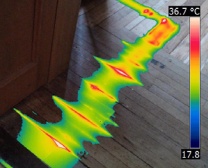
| It can be useful to combine parts of the temperature range of a thermal image with a visual image. Here the technique illustrates the path of a heating pipe below floorboards |
Thermal imaging is a useful technique for diagnosing the condition and behaviour of many aspects of buildings, visually revealing structural deficiencies. Applications include: detection of moisture and water infiltration, observing thermal bridges, voids, cracks or delamination, locating areas of heat loss or air leakage and assessing the performance of insulation. Anything that results in a temperature contrast on a surface can be usefully imaged by thermography.
Thermal cameras look very like digital photographic cameras but instead of using visible light they detect infrared radiation (IR), a form of light which is invisible to the human eye as it occurs beyond the red end of the visible light spectrum (0.4-0.76 μm). IR cameras work with wavelengths between 2 and 14 μm, although no single camera covers the entire range. Different types of IR camera are appropriate for different applications. Cameras which detect medium wave IR (2-5 μm) are used in specialist laboratory, medical and military applications.
Cameras for building thermography detect long wave IR (8-14 μm). Although they are mainly used to take single images, higher specification IR cameras can also take images in time lapse or video format. Specialist lenses allowing telephoto and wide angle imaging are available. Wide angle lenses can be particularly useful in building thermography when working indoors in small spaces or externally to capture wide areas of facades in a single image.
The resolution of most thermal cameras is not as high as that of photographic cameras. Low-cost IR cameras have a resolution of about 60x60 pixels while some higher specification cameras achieve 640x480 pixels. IR cameras also vary in their thermal sensitivity (the smallest difference in temperature they can resolve). The more sensitive the detector, the more detail will be visible in a thermal image, especially when temperature differences are relatively small.
Infrared radiation of the wavelengths we are interested in (8-14 μm) does not pass through glass. This means that the camera cannot be used to see objects behind glass. Also, the camera cannot use glass lenses; the lenses in long wave IR cameras are made of germanium.
 |
 |
|
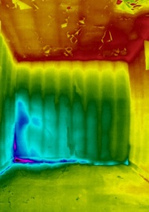
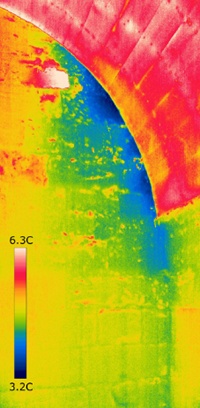
| Always verify the cause of a thermal anomaly. The cold patch on the left is caused by dampness; that on the right by a cold draught. | ||
Infrared radiation is emitted by all objects at temperatures above absolute zero (-273°C). The warmer the object, the more infrared radiation it emits. The IR camera converts the intensity of radiation to a visible image (or ‘thermogram’) in which every pixel represents a temperature.
Various colour schemes are available. The choice depends on what is being illustrated. Heat losses are often illustrated with the ‘iron’ colour scheme as it emphasises the importance of hot spots, highlighting them in white and yellow. The ‘rainbow’ colour scheme is often useful for illustrating dampness or draughts, emphasising colder areas in blues and purples. Inconsistencies in thermal images are called anomalies and they may indicate a problem with the building fabric.
The thermogram is more than just an image, it is a ‘radiometric’ image – each pixel records a spot temperature allowing, for example, cross-sections or areas of data to be exported to a spreadsheet for further analysis or to produce a graphic representation of a temperature profile. It is useful to have an ordinary digital image as well as it is not always easy to tell what is being shown in a complex thermal image. It can be difficult to locate an anomaly on an area of wall which is visually uniform without an accompanying visual image. Most thermal cameras capture a digital image at the same time as the thermal image ensuring that both illustrate the same area in the same orientation.
GETTING THE CONDITIONS RIGHT
For useful thermal images to be recorded there needs to be a temperature contrast. In an unheated building where there is no external heat source (solar heating, for example) all surfaces will tend to be at a similar temperature and no useful information will be obtained. Without heat to drive evaporation, a damp patch on a wall will have the same temperature as an adjacent dry surface.
 |
|
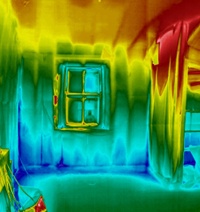
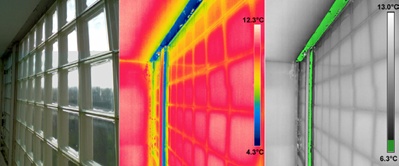
| Visual, thermal and dewpoint thermal images of this window illustrate how surfaces with a temperature below dewpoint can be highlighted. Condensation risk is illustrated in green on the right hand image. |
To get useful data we need to heat an object above ambient background temperature (or cool it below ambient) and observe it while it is warming up or cooling down. The bigger the temperature contrast, the better the thermal images. For this reason, most thermal imaging for heat loss is done in the winter months when the temperature contrast between the interior and exterior of buildings is greatest.
Heating may come from man-made sources such as domestic heating or from the sun – solar heating. Domestic heating is often used in building thermography, supplemented as necessary by additional heaters. As a rough rule of thumb, a building should be heated to at least 10°C above ambient temperatures for about 24 hours before thermal imaging commences.
To see structures or voids below the immediate surface, a longer period of heating may be needed so that heat has time to penetrate to the depth required. In massed stone structures wall thicknesses may be substantially greater than in a domestic setting and heating times and intensity may need to be increased.
It should be noted that intense heating of some spaces may not be appropriate if they contain materials which could be damaged, for example wooden structures which could suffer shrinkage, or fragile painted plaster. In these cases the thermographer will have to make the best of such heating as can be safely achieved.
 |
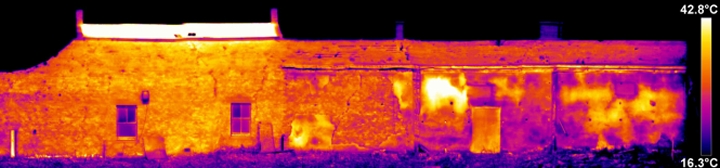 |
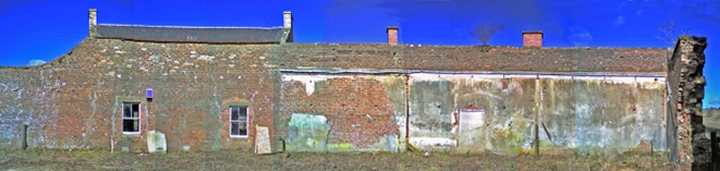
| This brick building with areas of harling is fully sunlit. Hot patches on the harling show areas of detachment as heat is trapped on the surface. This thermogram uses the ‘iron’ colour scheme. |
The success of thermal imaging outdoors is dependent on the weather and the time of day. Wind will tend to chill surfaces, effectively blowing away any thermal anomalies, reducing the temperature contrast between hot and cold areas. Thermal imaging is unlikely to be successful if the wind is gusting at over 20mph (approximately 10m/s). Unless the object is to observe wetting patterns on buildings, the surface should not be wet (or recently wet) from rainfall as evaporative cooling will confuse the thermal emissions the imaging is intended to observe.
If the object is to observe heat losses from structures then thermal imaging has to be carried out during the hours of darkness, when solar heating will not confuse the issue. The ideal time to conduct a survey to localise heat losses is in the early morning before sunrise. This allows time for any solar heating of the building on the previous day to dissipate.
LOCATING MOISTURE
Thermography is very useful in the detection of dampness. When surfaces are warmed, damp patches remain relatively cold due to evaporative cooling as moisture is lost from the surface. The situation is more complex when moisture is held at depth, as may be the case in a solid masonry structure. Evaporative cooling can only take place when water is present on or near the surface. When moisture is trapped below the surface and heating has been of sufficient intensity and duration, trapped water will show up as a hot spot. This potentially confusing effect is caused by differences in the thermal capacity of the water and the wall. Water holds heat longer than dry stone, so during cooling a mass of water inside a wall shows up as a warm patch. Whether cooling down or warming up, a wet wall will change temperature more slowly than a dry wall.
 |
||
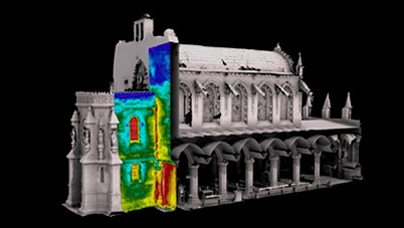
| This image combines 3D laser scanning with thermal imaging to produce a 3D thermogram. Air leakage at the junction between the original 16th- century structure and a Victorian addition is the cause of significant heat loss. High heat loss is also observed on the thin stonework at the end of the aisle. The thickness of the stone wall at this point would not have been easily observed without access to 3D scan data. | ||
 |
 |
|
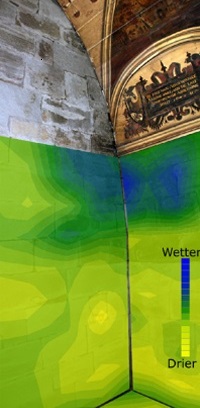
| Evaporation of moisture from this masonry wall is the cause of cooler patches in the thermal image (left). Concentrations of moisture below the surface (right) were confirmed using a microwave moisture sensor which is able to detect moisture at depths up to 20-30cm. | ||
Not all damp problems are caused by water ingress, some are due to condensation. As it displays the temperature of surfaces, IR thermography can predict areas at risk of condensation provided the values for air temperature and relative humidity are input. Some cameras have software to perform a dewpoint calculation and will display condensation risk as a differently coloured overlay on the thermal image.
SUB-SURFACE INFORMATION
The IR camera only sees the temperature of surfaces, but it can provide information about the deeper structure where this affects surface temperature. As noted, a mass of warm water in a masonry wall will be observed as a warm patch on the surface. In thermal bridging, observation inside a heated building will show a cold area where heat flow to the outside is unusually high, while observation outside the building will show a thermal bridge as a hot patch.
The pattern of variations in heat flow can often give clues to sub-surface structures. Sources of heat within or behind a structure can be located. Thermography can show the location of warm flues in gable walls, it can be used to visualise the performance of underfloor heating and to locate hot water and heating pipes. It can therefore be useful for locating problems without having to open up the floor or wall.
Although solar heating can often confound imaging, in some instances it can be very useful. On sunlit walls heat will flow most readily into a structure with no thermal barriers. If a wall has voids, blistering, detached harling or roughcast, heat will tend to be trapped on the outside of a sunlit wall, finding it more difficult to flow through the wall compared to adjacent solid areas. This method can be used to detect detached external finishes on sunlit walls.
ENERGY EFFICIENCY
The ability to visualise heat makes thermography a powerful tool for studying energy efficiency. Excessive levels of heat loss through a structure are easily located. Further investigation will be required to determine whether the cause is lack of insulation, air leakage or some other defect.
The insulation value of building materials is often quoted as a U-value. This is a measure of the thermal transmittance of a material or structure. As the thermal camera observes radiant heat loss from surfaces there are methods for deriving U-values from thermal images. The results are dependent on several assumptions and can be significantly affected by local conditions. The U-values derived from thermal imaging data are not as reliable as those from measurements derived from in situ heat flow sensors, which average heat flow over a long period, reducing errors caused by unstable atmospheric conditions. Thermal images record only a single point in time.
 |
|
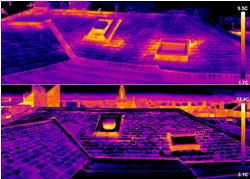
| Slate roof before (above) and after (below) insulation of the roof space. Heat losses on ridges and around the skylight have been significantly reduced following insulation. |
Air leaks are a problem where they lead to higher energy consumption or to condensation. Air leaks can be detected with a thermal camera, especially when used in combination with a ‘blower door’ which is used to reduce the air pressure inside a building. The IR camera is used on the lower pressure side (indoors) and air leaks will show up as cooler areas as air is drawn into the structure. The camera does not see the air flow itself, it sees the cooling effect on adjacent surfaces.
CONFIRMING THE CAUSE OF THERMAL ANOMALIES
Imaging can easily locate thermal anomalies but the cause is not always obvious. Anomalous cold patches are not always caused by dampness – draughts can look very similar. The corners of rooms are normally colder and this does not indicate a problem; warm air does not circulate so well into corners and they have a relatively large external surface from which to radiate heat. It is important to ensure that what is being observed is an anomaly and not a normal temperature variation. The area in question should be compared to other similar areas and potential causes of the temperature anomaly investigated. Often, confirmation by further inspection will be required. This may involve the use of equipment such as moisture sensors or careful examination of building plans.
In some situations thermal imaging can also be usefully combined with 3D laser scanning to produce 3D thermal images. This is particularly useful in complex buildings where the relationship between different parts of the structure may be difficult to visualise. For example, tracing water leaks through a complex structure to determine the source of ingress may be easier if the thermal data can be visualised in three dimensions.
A thermal image should not be taken at face value. The diagnosis should always be confirmed by further inspection.
~~~
Recommended Reading
BINDT, Infrared Thermography Handbook Vol 1: Principles and Practice, 2004
BINDT, Infrared Thermography Handbook Vol 2: Applications, 2004
BS EN 13187:1999, Thermal performance of buildings. Qualitative detection of thermal irregularities in building envelopes. Infrared method
FLIR, Infrared guidebook for building applications, 2009
FLIR, Thermal imaging guidebook for building and renewable energy applications, 2011
M Vollmer and KP Möllmann, Infrared Thermal Imaging: Fundamentals, Research and Applications, Wiley-VCH, Germany, 2010
T Ward, Information Paper IP1/06, Assessing the effects of thermal bridging at junctions and around openings, 2006