


 24 / 54

24
BCD SPECIAL REPORT ON
HERITAGE RETROFIT
FIRST ANNUAL EDITION
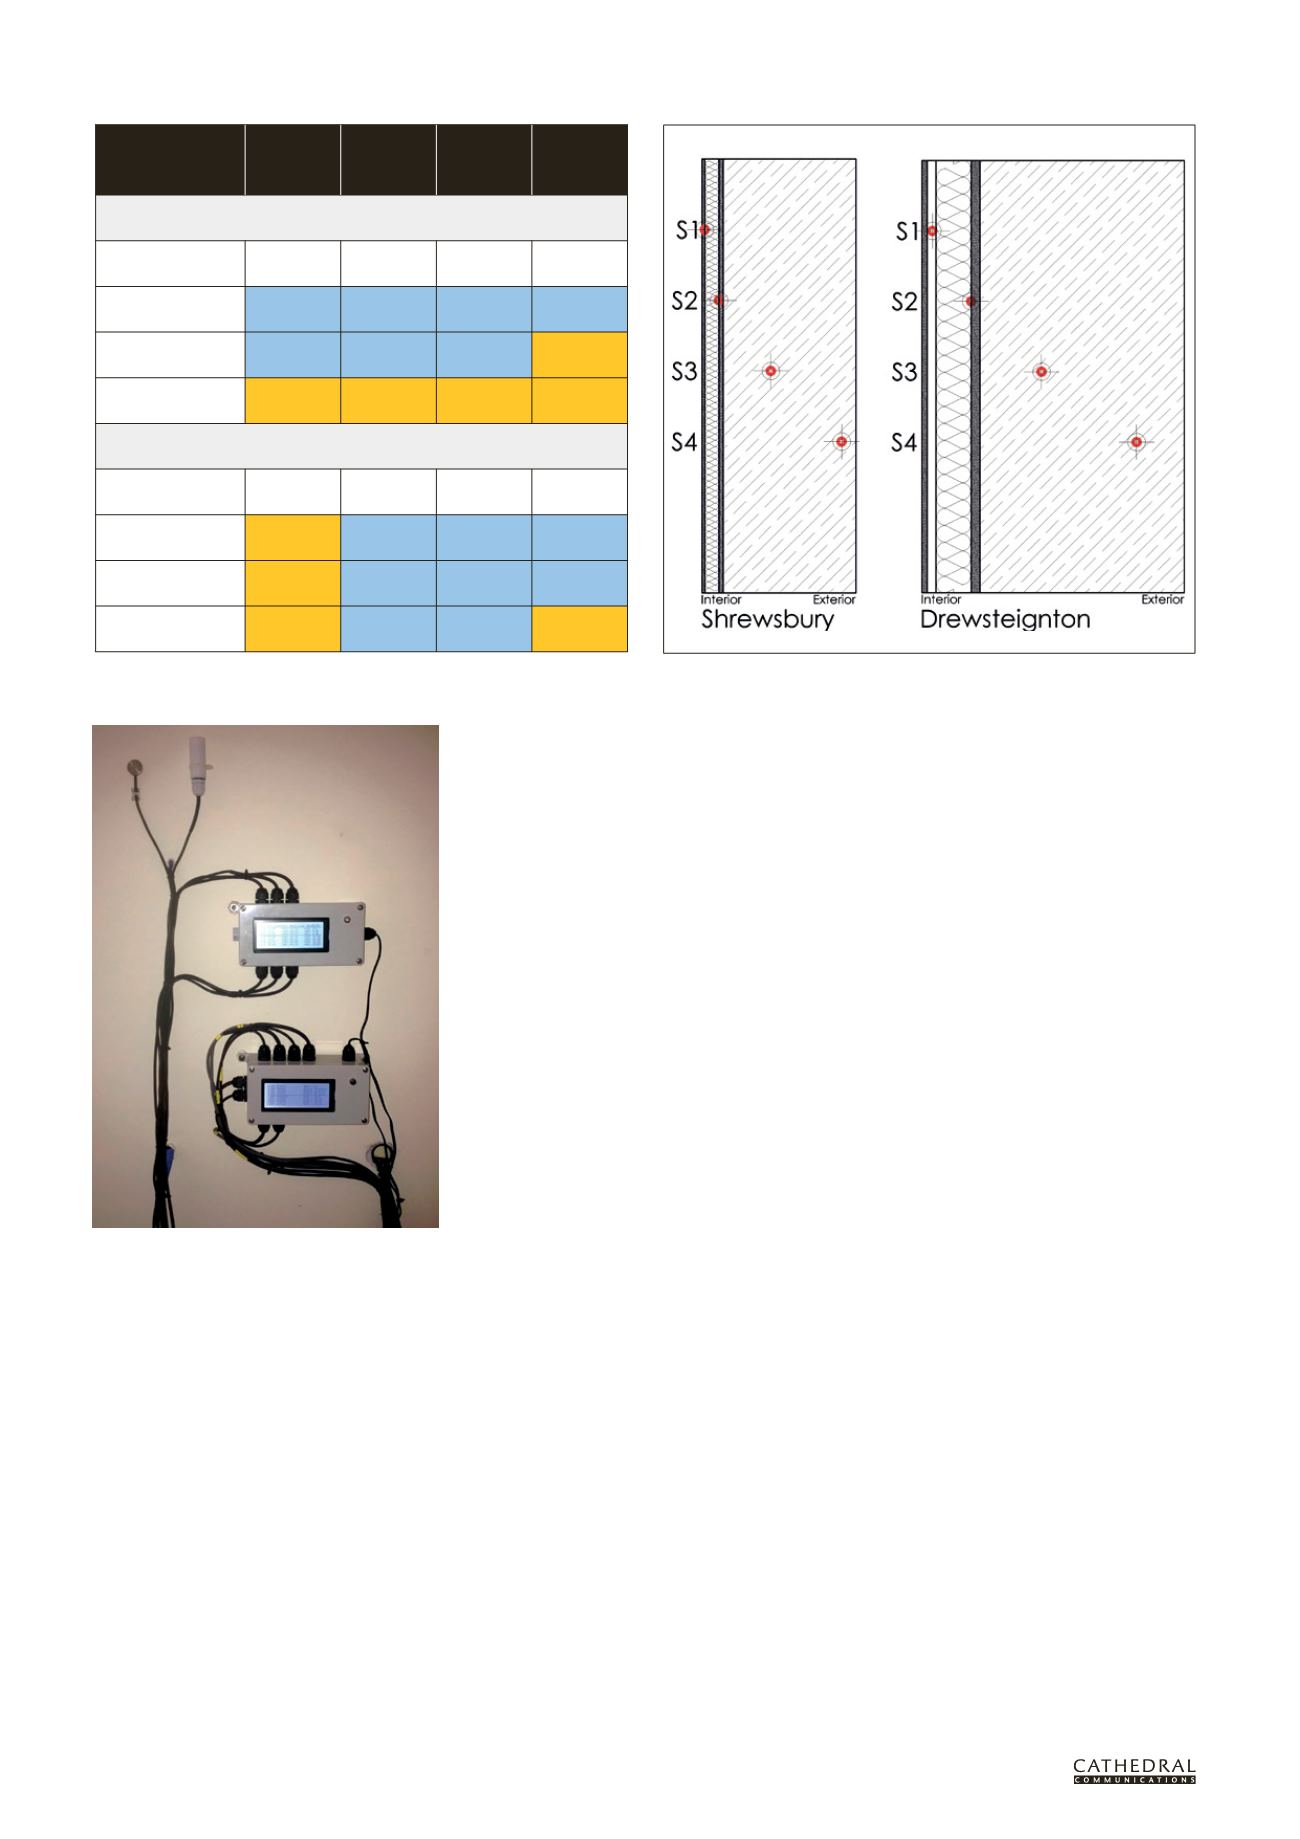
Annual Average
Sat Margins
Sensor 1 Sensor 2 Sensor 3 Sensor 4
SHREWSBURY
2011
6.46°C 6.41°C 5.12°C 3.96°C
2012–2013
6.34°C 5.08°C 4.30°C 3.08°C
2013–2014
6.33°C 5.00°C 4.08°C 3.45°C
2014–2015
6.85°C 5.16°C 4.20°C 4.24°C
DREWSTEIGNTON
2011
5.30°C 4.82°C 3.53°C 2.38°C
2012–2013
5.60°C 2.23°C 1.53°C 0.57°C
2013–2014
6.90°C 1.97°C 1.14°C 0.49°C
2014–2015
7.09°C 1.58°C 0.67°C 0.59°C
Table 1 Annual average saturation margins for interstitial sensors 2011–2015.
Orange shading indicates increased margins, blue indicates decreased margins
air is used to provide an indication of
the moisture performance of the wall.
The use of air as a proxy medium
for moisture measurements has a
number of advantages. As a quantity
it provides an indication of dew point
conditions within the wall (100% RH)
and %RH is commonly used within
fabric risk indices, 80 per cent being
the threshold value often quoted for the
formation of mould growth (see Further
Information: DCLG and Altamirano-
Medina). Unlike measurements of
moisture made via electrical resistivity,
it is unaffected by salt contamination
and does not rely on assumptions
regarding resistivity and moisture
content, which is material-dependent
and can therefore be hugely variable.
In order to identify the fundamental
drivers of hygrothermal performance
within the walls, as opposed to just
seasonal differences when the walls may
become wet as a result of local weather
conditions, long-term monitoring of
fabric is necessary. By 2015 it was felt that
sufficient evidence had been gathered to
be able to describe, with some certainty,
the reasons for the different performance
of the walls in the BPS.
Of the two internally insulated solid
walls featured in this study, the first was
a 345mm brick wall at Shrewsbury which
was insulated with 40mm of woodfibre
board and finished with 20mm of lime
plaster. This wall does not incorporate
any formal vapour control layer (VCL).
The addition of a VCL is standard
practice when adding internal insulation
to solid walls to limit the movement
of internal room vapour into the wall
where cold fabric beyond the insulation
might cause vapour to condense, but the
practice has been called into question
by conservation specialists where
traditional solid walls are concerned.
The other example chosen for the
study was a 600mm granite wall at
Drewsteignton in Devon. This wall had
been internally insulated with 100mm
of polyisocyanurate (PIR) board and,
following manufacturers guidelines, an
air gap, plasterboard and gypsum skim
finish. In this construction the insulation
is bound front and back with a metallised
foil sheet which, being impermeable,
performs the function of a VCL.
Findings from the interstitial
hygrothermal monitoring are examined
across a number of bases. Vapour
behaviour is examined as both relative
and absolute humidity as well as in
the form of dew point gradients which
extend through the wall section. Dew
point gradients are compared against the
actual temperature gradients measured
through the wall, the difference between
the two being the drop in temperature
required to create saturation conditions.
This difference, which is described as
the ‘saturation margin’ and is measured
in °C, provides another indicator
of risk for the wall in terms of how
close the air is to saturation, for what
duration and at which times of year.
In 2012, following insulation, the
saturation margins measured in both
walls narrowed, something that might
be expected for internally insulated walls
as temperatures reduce on the cold side
of the insulation. However, it is long-
term trends that are most of interest and
here we see a difference between the
walls. Saturation margins continue to
narrow year on year in the granite wall at
Drewsteignton, indicating a wall moving
closer to permanent saturation of the air
within parts of its structure. The other
internally insulated wall, at Shrewsbury,
appears more stable with wider margins
and little year on year change in these
following insulation.
Another way to examine moisture
behaviour in the walls is to study
their RH profiles. In particular, RH
behaviour in the central part of the
Monitoring equipment installed on the internally
insulated granite wall at Drewsteignton
Figure 1 Wall sections showing build-ups and locations of sensors for walls at
Shrewsbury and Drewsteignton