


 25 / 54

BCD SPECIAL REPORT ON
HERITAGE RETROFIT
FIRST ANNUAL EDITION
25
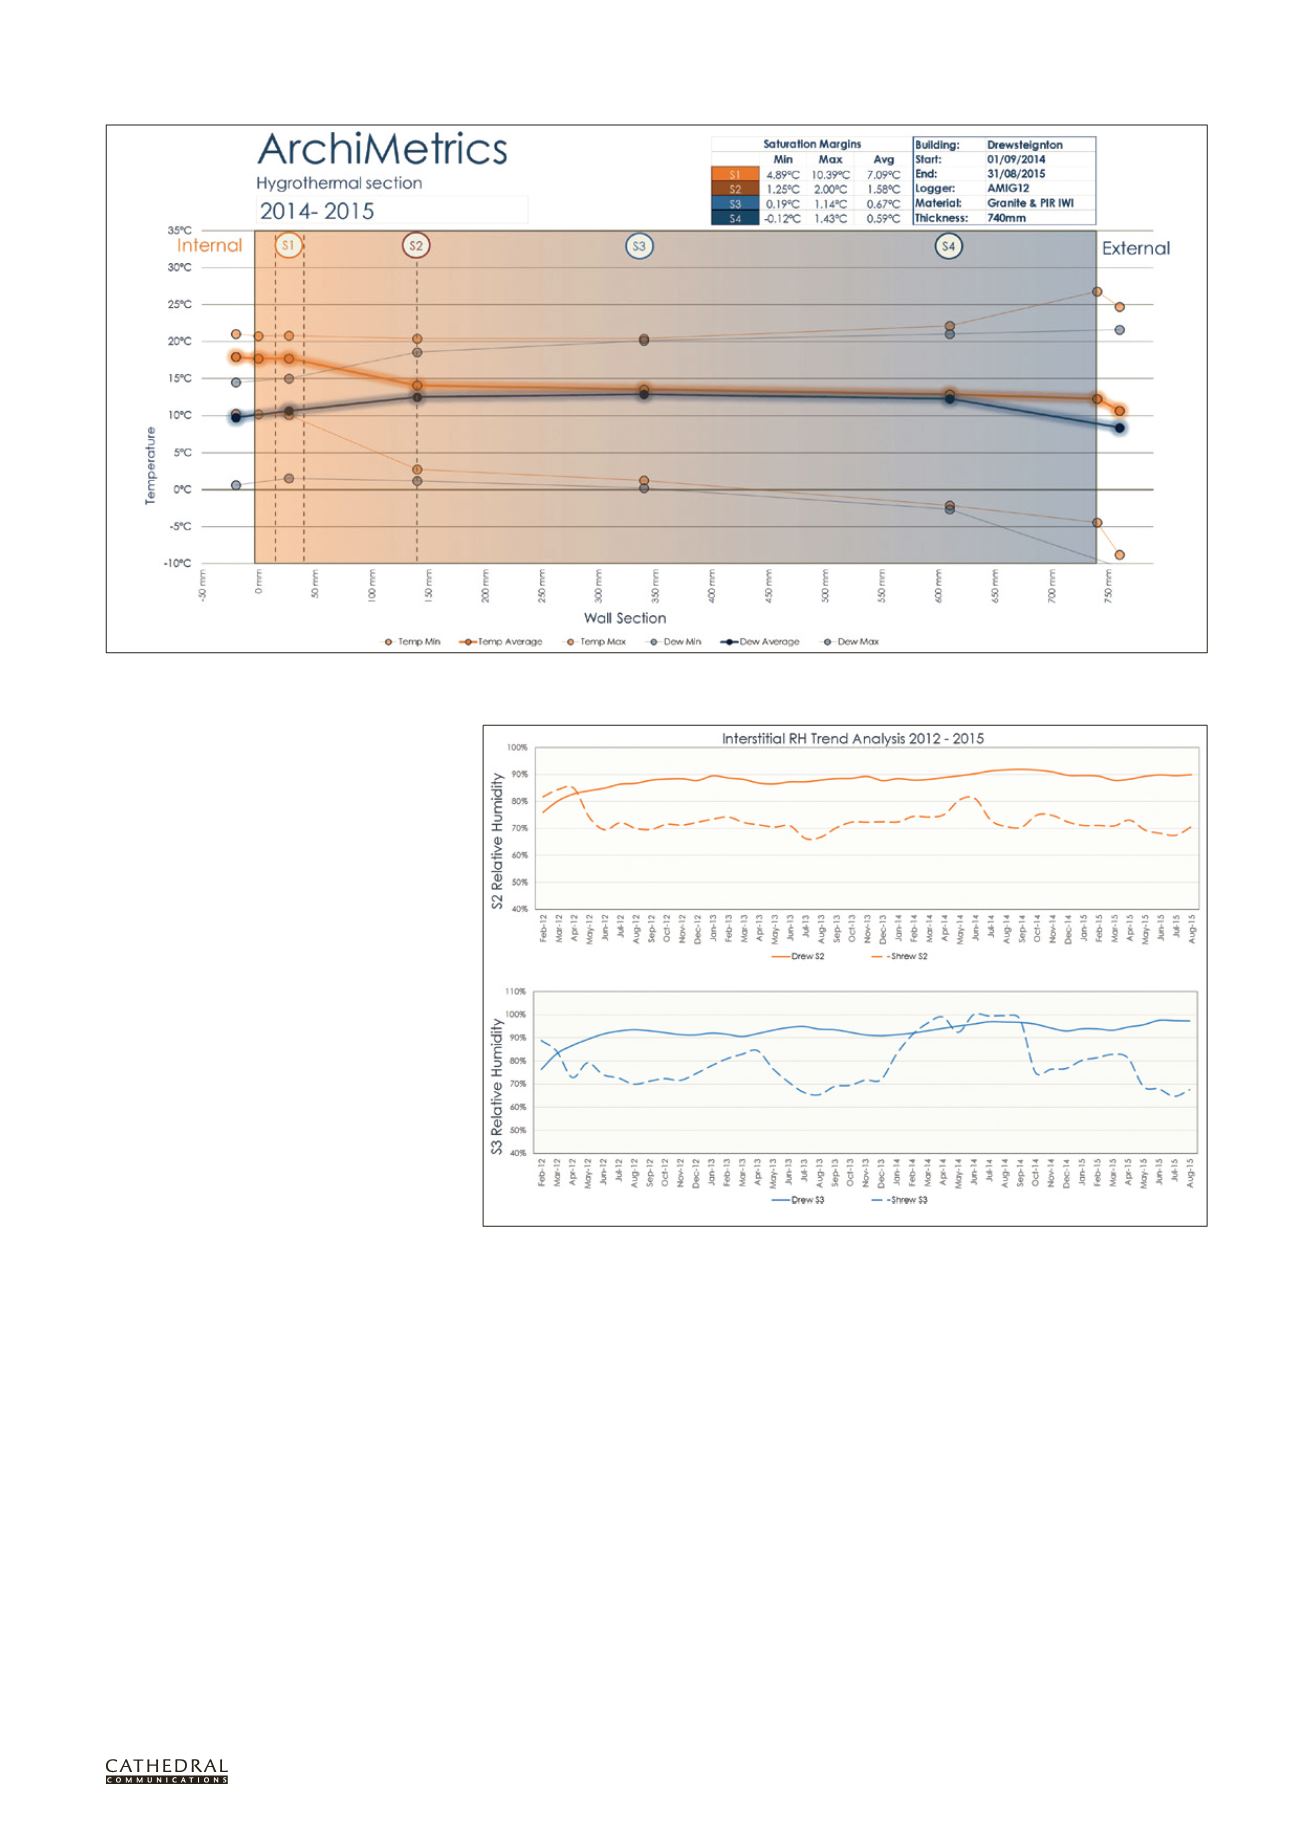
walls, at sensors 2 and 3, is indicative
of its underlying performance because
this part of the wall is less influenced by
both the wetting and drying influences
of external and internal environments.
In Figure 3 it can be seen that since
2012 measurements of RH at sensors 2
and 3 within the wall at Drewsteignton
rise immediately following the application
of insulation and continue to rise over
three years of measurements. There are
periods of rising RH seen in the traces
from sensors in the Shrewsbury wall
but these are also seen to fall at certain
times of the year indicating periods
when the air in the wall is able to dry via
evaporation. Importantly, at Shrewsbury,
there are also times when RH quantities
fall below those initially measured
immediately after the wall was insulated,
something not seen at Drewsteignton.
In terms of risk, the quantities of
RH measured at Drewsteignton exceed
80% from March 2012 onwards and
would suggest that the wall, or perhaps
more accurately certain materials such
as timbers which are embedded in the
wall, may be at risk of mould growth. The
majority of the measurements for the wall
at Shrewsbury fall below 80%.
The reasons for the differences in
moisture behaviour between the two
walls originate in their very different
constructions. It is possible, however, to
extrapolate from this certain qualities that
determine moisture behaviour and apply
this learning to solid walls more generally.
The wall at Shrewsbury is south-
facing and, compared to that at
Drewsteignton, quite thin. The pointing
is in poor condition and the brick is quite
porous and permeable. It has also been
insulated with a relatively small quantity
of a vapour-open, capillary-active and
hygroscopic material with no formal VCL.
Of the walls under study, it is the driest
in terms of both relative and absolute
humidity (%RH and AH g/m
3
) and it has
the widest saturation margins. Vapour
responses in this wall are very dynamic
and at times quite extreme. This is due
to the nature and orientation of the
construction. The external side of the wall
quickly becomes wet during periods of
driving rain and this moisture can easily
penetrate towards the centre of the wall.
However, the wall also dries out rapidly
due to heat from direct (and diffuse)
solar radiation and plentiful air exchange
through the substrate.
It is noticeable that, despite this
volatility, overall the wall operates below
the 80% RH threshold for mould growth.
It is also possible that the quantity of
insulation installed (40mm), which
reduced the measured in situ U-value
from 1.48 W/m
2
K to 0.48 W/m
2
K,
ensures that while the passage of heat
through the wall is reduced, sufficient
heat still travels from interior to exterior
during colder winter periods to provide
a safe margin between the measured
air temperature and the dew point
temperature. It is important to note that
Figure 2 Hygrothermal section showing temperature and dew point gradients for the wall at Drewsteignton
Figure 3 RH trends for the walls at Drewsteignton (solid) and Shrewsbury (dotted), 2011-2015