T W E N T Y F I R S T E D I T I O N
T H E B U I L D I N G C O N S E R VAT I O N D I R E C T O R Y 2 0 1 4
4 7
1
PROFESSIONAL SERVICES
behind glass. Also, the camera cannot
use glass lenses; the lenses in long wave
IR cameras are made of germanium.
Infrared radiation is emitted by all
objects at temperatures above absolute zero
(-273°C). The warmer the object, the more
infrared radiation it emits. The IR camera
converts the intensity of radiation to a visible
image (or ‘thermogram’) in which every pixel
represents a temperature. Various colour
schemes are available. The choice depends
on what is being illustrated. Heat losses
are often illustrated with the ‘iron’ colour
scheme as it emphasises the importance
of hot spots, highlighting them in white
and yellow. The ‘rainbow’ colour scheme is
often useful for illustrating dampness or
draughts, emphasising colder areas in blues
and purples. Inconsistencies in thermal
images are called anomalies and they may
indicate a problem with the building fabric.
The thermogram is more than just an
image, it is a ‘radiometric’ image – each pixel
records a spot temperature allowing, for
example, cross-sections or areas of data to be
exported to a spreadsheet for further analysis
or to produce a graphic representation of a
temperature profile. It is useful to have an
ordinary digital image as well as it is not always
easy to tell what is being shown in a complex
thermal image. It can be difficult to locate an
anomaly on an area of wall which is visually
uniform without an accompanying visual
image. Most thermal cameras capture a digital
image at the same time as the thermal image
ensuring that both illustrate the same area in
the same orientation.
GETTING THE CONDITIONS RIGHT
For useful thermal images to be recorded
there needs to be a temperature contrast. In an
unheated building where there is no external
heat source (solar heating, for example)
all surfaces will tend to be at a similar
temperature and no useful information will be
obtained. Without heat to drive evaporation,
a damp patch on a wall will have the same
temperature as an adjacent dry surface. To get
useful data we need to heat an object above
ambient background temperature (or cool
it below ambient) and observe it while it is
warming up or cooling down. The bigger the
temperature contrast, the better the thermal
images. For this reason, most thermal imaging
for heat loss is done in the winter months when
the temperature contrast between the interior
and exterior of buildings is greatest.
Heating may come from man-made
sources such as domestic heating or from
the sun – solar heating. Domestic heating
is often used in building thermography,
supplemented as necessary by additional
heaters. As a rough rule of thumb, a building
should be heated to at least 10°C above
ambient temperatures for about 24 hours
before thermal imaging commences.
To see structures or voids below the
immediate surface, a longer period of heating
may be needed so that heat has time to
penetrate to the depth required. In massed
stone structures wall thicknesses may be
substantially greater than in a domestic setting
and heating times and intensity may need to
be increased. It should be noted that intense
heating of some spaces may not be appropriate
if they contain materials which could be
damaged, for example wooden structures
which could suffer shrinkage, or fragile painted
plaster. In these cases the thermographer will
have to make the best of such heating as can be
safely achieved.
The success of thermal imaging outdoors
is dependent on the weather and the time of
day. Wind will tend to chill surfaces, effectively
blowing away any thermal anomalies, reducing
the temperature contrast between hot and
cold areas. Thermal imaging is unlikely to be
successful if the wind is gusting at over 20mph
(approximately 10m/s). Unless the object is
to observe wetting patterns on buildings,
the surface should not be wet (or recently
wet) from rainfall as evaporative cooling will
confuse the thermal emissions the imaging is
intended to observe.
If the object is to observe heat losses from
structures then thermal imaging has to be
carried out during the hours of darkness, when
solar heating will not confuse the issue. The
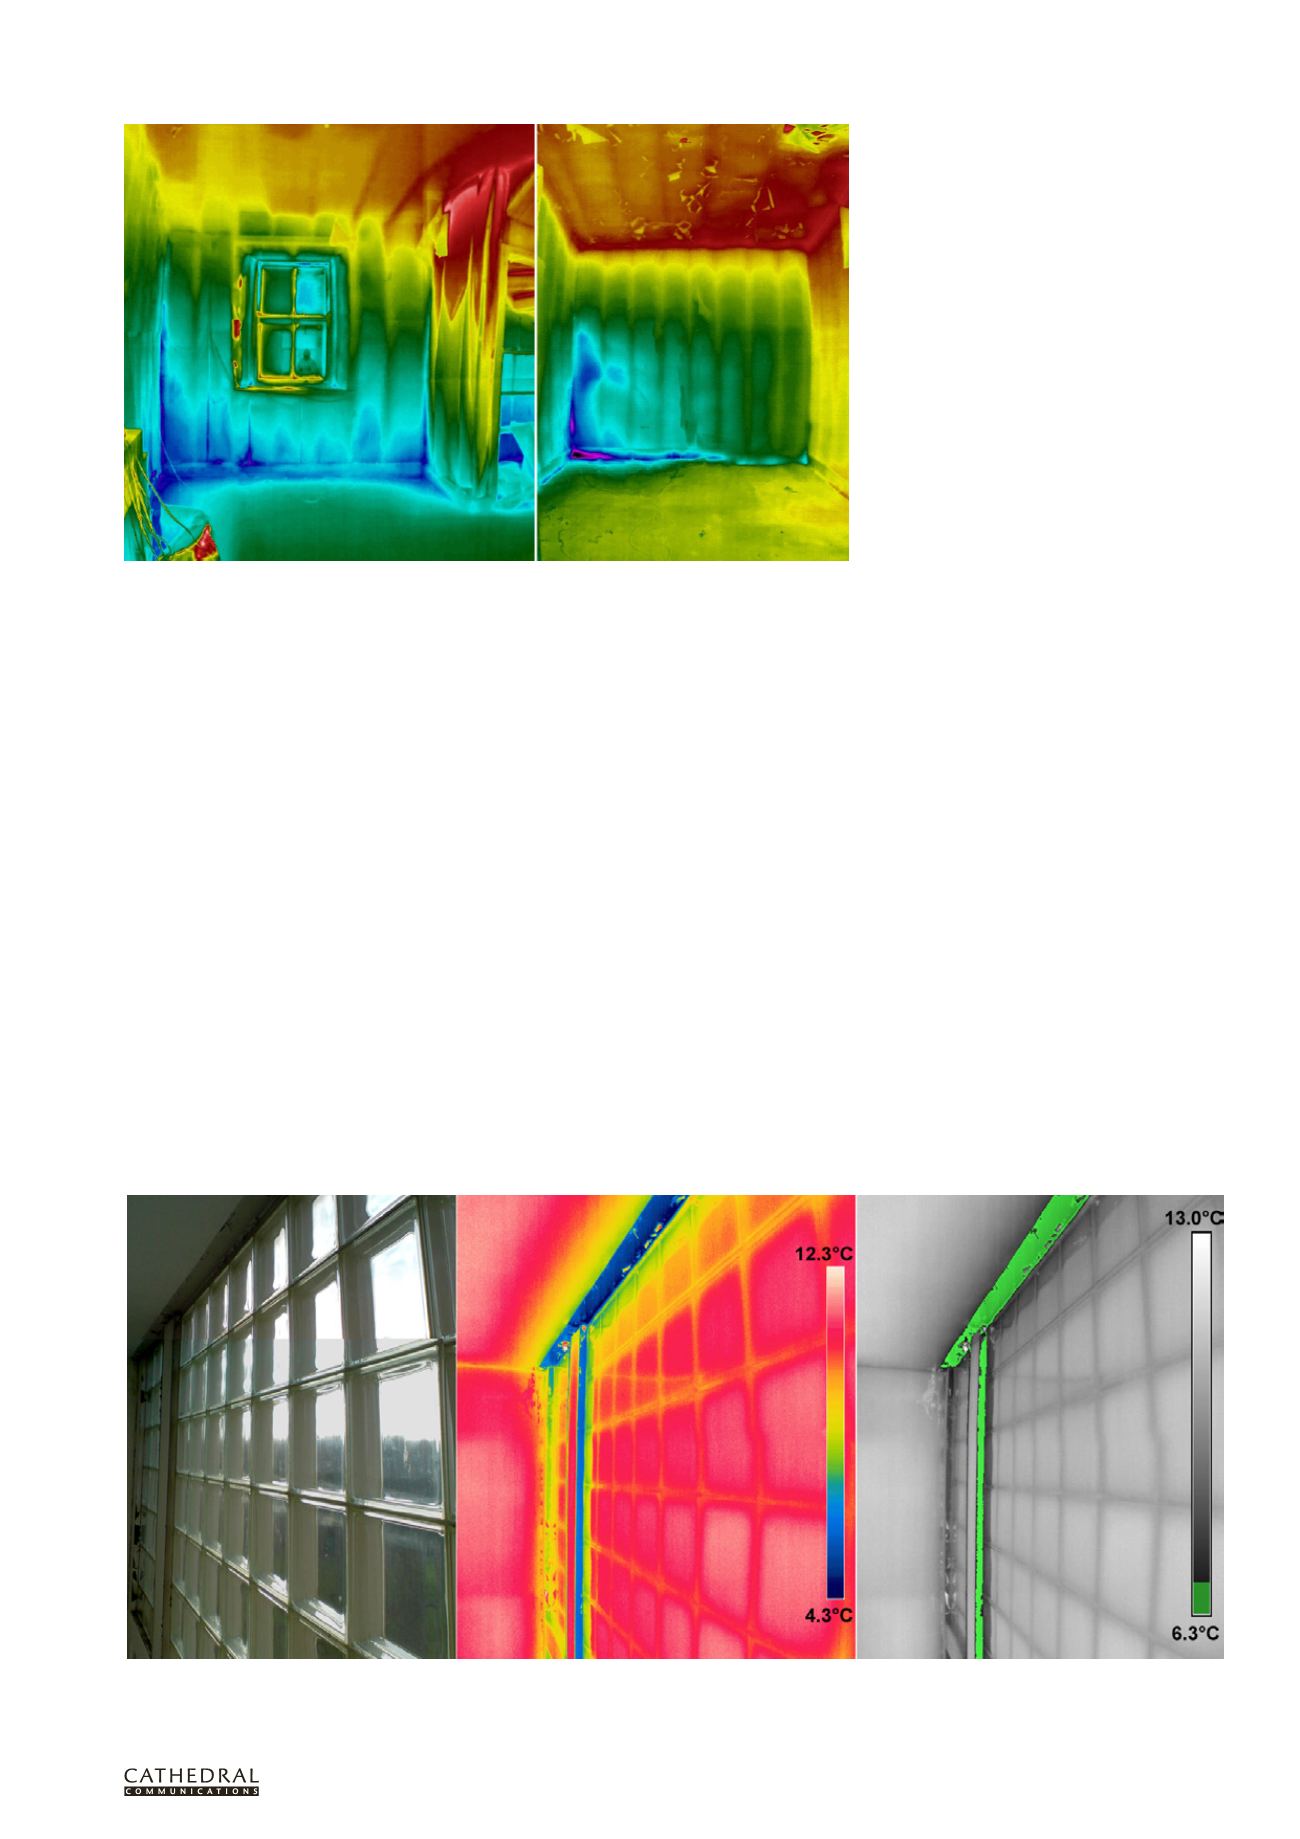
Always verify the cause of a thermal anomaly. The cold patch on the left is caused by dampness; that on the
right by a cold draught.
Visual, thermal and dewpoint thermal images of this window illustrate how surfaces with a temperature below dewpoint can be highlighted. Condensation risk is
illustrated in green on the right hand image.


