4 8
T H E B U I L D I N G C O N S E R VAT I O N D I R E C T O R Y 2 0 1 4
T W E N T Y F I R S T E D I T I O N
1
PROFESSIONAL SERVICES
ideal time to conduct a survey to localise heat
losses is in the early morning before sunrise.
This allows time for any solar heating of the
building on the previous day to dissipate.
LOCATING MOISTURE
Thermography is very useful in the detection
of dampness. When surfaces are warmed,
damp patches remain relatively cold due to
evaporative cooling as moisture is lost from
the surface. The situation is more complex
when moisture is held at depth, as may be the
case in a solid masonry structure. Evaporative
cooling can only take place when water is
present on or near the surface. When moisture
is trapped below the surface and heating has
been of sufficient intensity and duration,
trapped water will show up as a hot spot.
This potentially confusing effect is caused
by differences in the thermal capacity of the
water and the wall. Water holds heat longer
than dry stone, so during cooling a mass of
water inside a wall shows up as a warm patch.
Whether cooling down or warming up, a wet
wall will change temperature more slowly
than a dry wall.
Not all damp problems are caused by
water ingress, some are due to condensation.
As it displays the temperature of surfaces,
IR thermography can predict areas at risk
of condensation provided the values for air
temperature and relative humidity are input.
Some cameras have software to perform
a dewpoint calculation and will display
condensation risk as a differently coloured
overlay on the thermal image.
SUB-SURFACE INFORMATION
The IR camera only sees the temperature of
surfaces, but it can provide information about
the deeper structure where this affects surface
temperature. As noted, a mass of warm water
in a masonry wall will be observed as a warm
patch on the surface. In thermal bridging,
readily into a structure with no thermal
barriers. If a wall has voids, blistering,
detached harling or roughcast, heat will
tend to be trapped on the outside of a sunlit
wall, finding it more difficult to flow through
the wall compared to adjacent solid areas.
This method can be used to detect detached
external finishes on sunlit walls.
ENERGY EFFICIENCY
The ability to visualise heat makes
thermography a powerful tool for studying
energy efficiency. Excessive levels of heat loss
through a structure are easily located. Further
investigation will be required to determine
whether the cause is lack of insulation, air
leakage or some other defect.
observation inside a heated building will show
a cold area where heat flow to the outside is
unusually high, while observation outside the
building will show a thermal bridge as a hot
patch. The pattern of variations in heat flow
can often give clues to sub-surface structures.
Sources of heat within or behind a structure
can be located. Thermography can show the
location of warm flues in gable walls, it can be
used to visualise the performance of underfloor
heating and to locate hot water and heating
pipes. It can therefore be useful for locating
problems without having to open up the floor
or wall.
Although solar heating can often confound
imaging, in some instances it can be very
useful. On sunlit walls heat will flow most
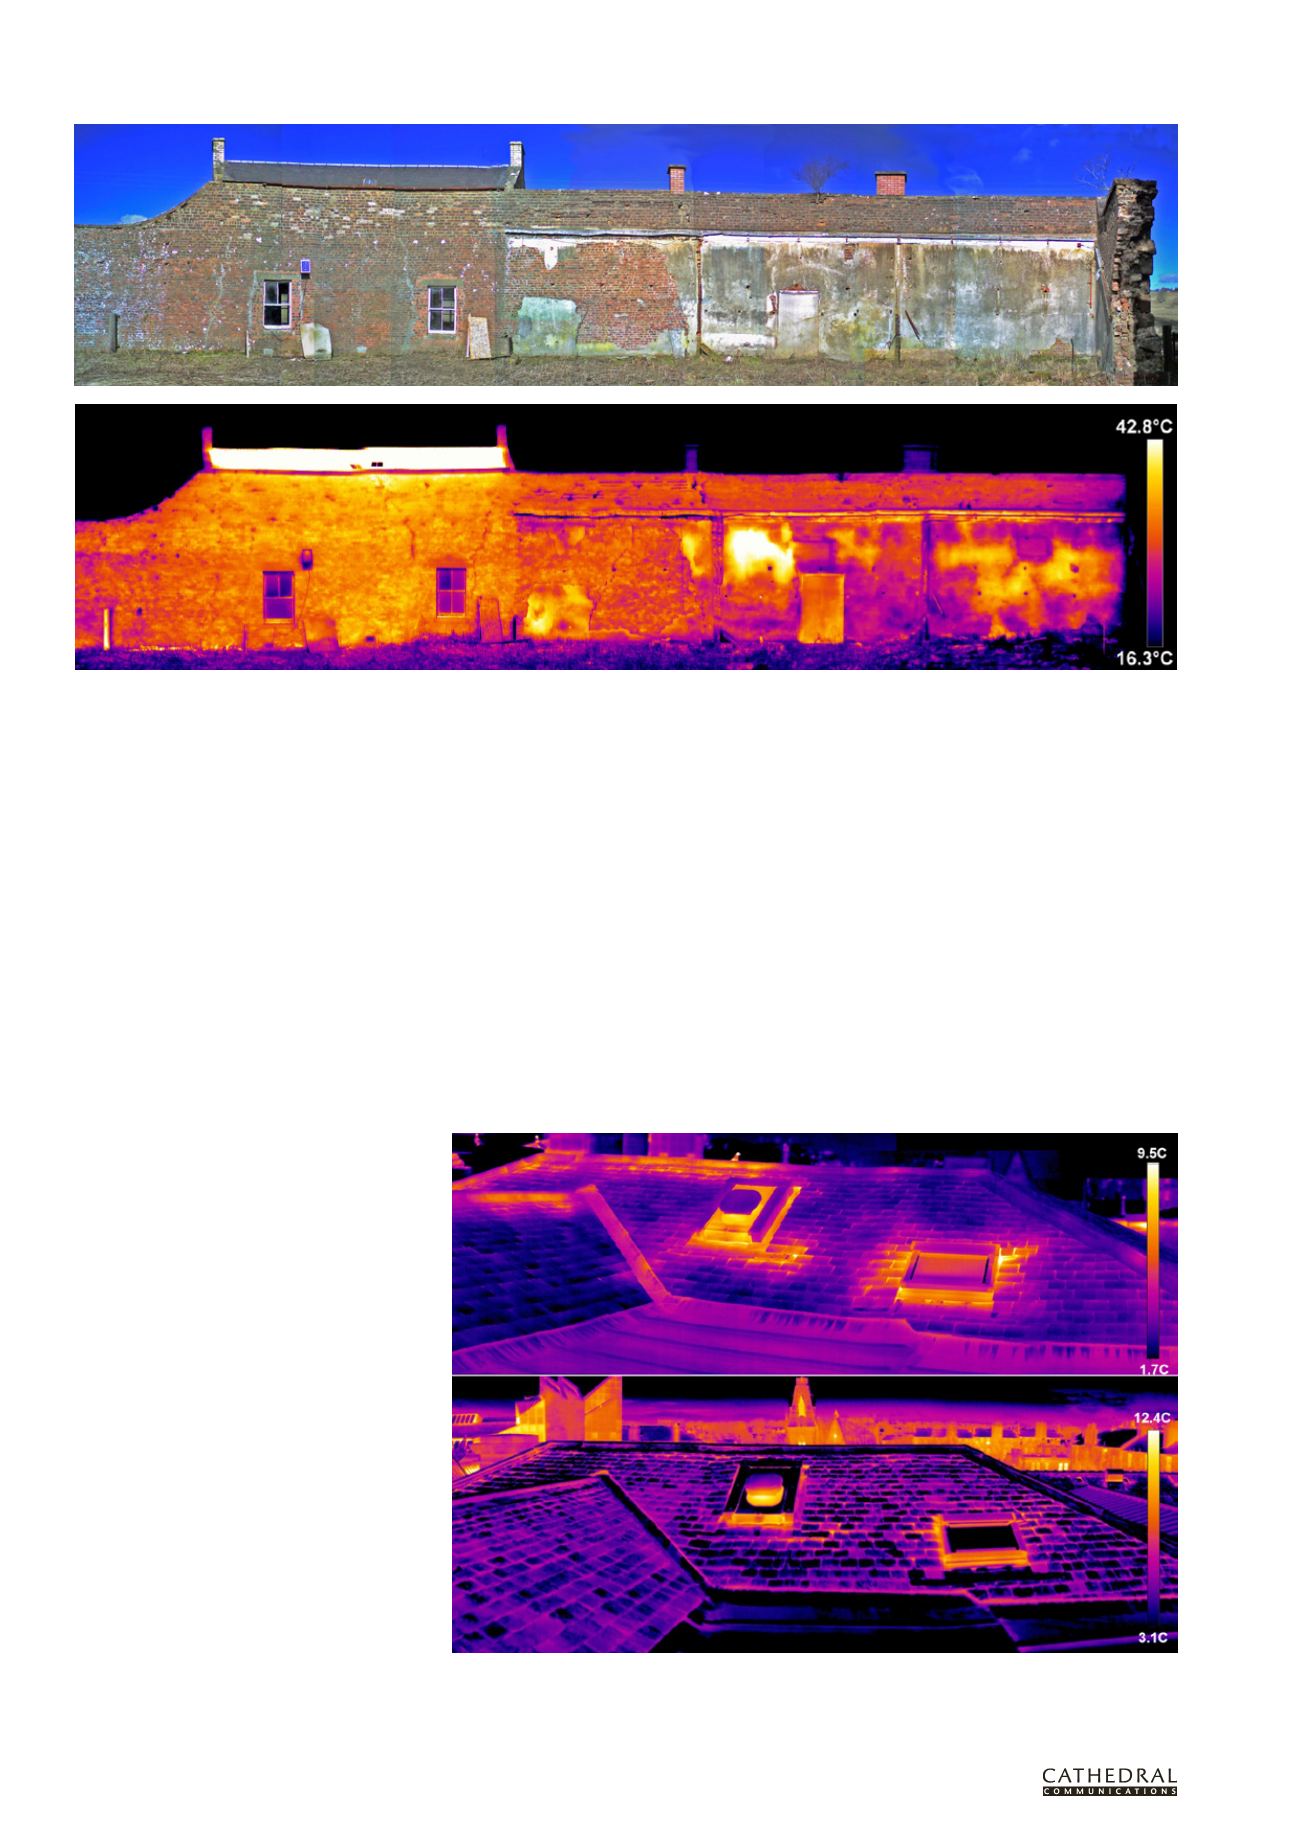
This brick building with areas of harling is fully sunlit. Hot patches on the harling show areas of detachment as heat is trapped on the surface. This thermogram uses the
‘iron’ colour scheme.
Slate roof before (above) and after (below) insulation of the roof space. Heat losses on ridges and around the
skylight have been significantly reduced following insulation.


