T W E N T Y F I R S T E D I T I O N
T H E B U I L D I N G C O N S E R VAT I O N D I R E C T O R Y 2 0 1 4
4 9
1
PROFESSIONAL SERVICES
The insulation value of building materials
is often quoted as a U-value. This is a measure
of the thermal transmittance of a material or
structure. As the thermal camera observes
radiant heat loss from surfaces there are
methods for deriving U-values from thermal
images. The results are dependent on several
assumptions and can be significantly affected
by local conditions. The U-values derived
from thermal imaging data are not as reliable
as those from measurements derived from in
situ heat flow sensors, which average heat flow
over a long period, reducing errors caused by
unstable atmospheric conditions. Thermal
images record only a single point in time.
Air leaks are a problem where they
lead to higher energy consumption or to
condensation. Air leaks can be detected with
a thermal camera, especially when used in
combination with a ‘blower door’ which is used
to reduce the air pressure inside a building.
The IR camera is used on the lower pressure
side (indoors) and air leaks will show up as
cooler areas as air is drawn into the structure.
The camera does not see the air flow itself, it
sees the cooling effect on adjacent surfaces.
CONFIRMING THE CAUSE OF
THERMAL ANOMALIES
Imaging can easily locate thermal anomalies
but the cause is not always obvious.
Anomalous cold patches are not always
caused by dampness – draughts can look
very similar. The corners of rooms are
normally colder and this does not indicate a
problem; warm air does not circulate so well
into corners and they have a relatively large
external surface from which to radiate heat.
It is important to ensure that what is being
observed is an anomaly and not a normal
temperature variation. The area in question
should be compared to other similar areas and
potential causes of the temperature anomaly
investigated. Often, confirmation by further
inspection will be required. This may involve
the use of equipment such as moisture sensors
or careful examination of building plans.
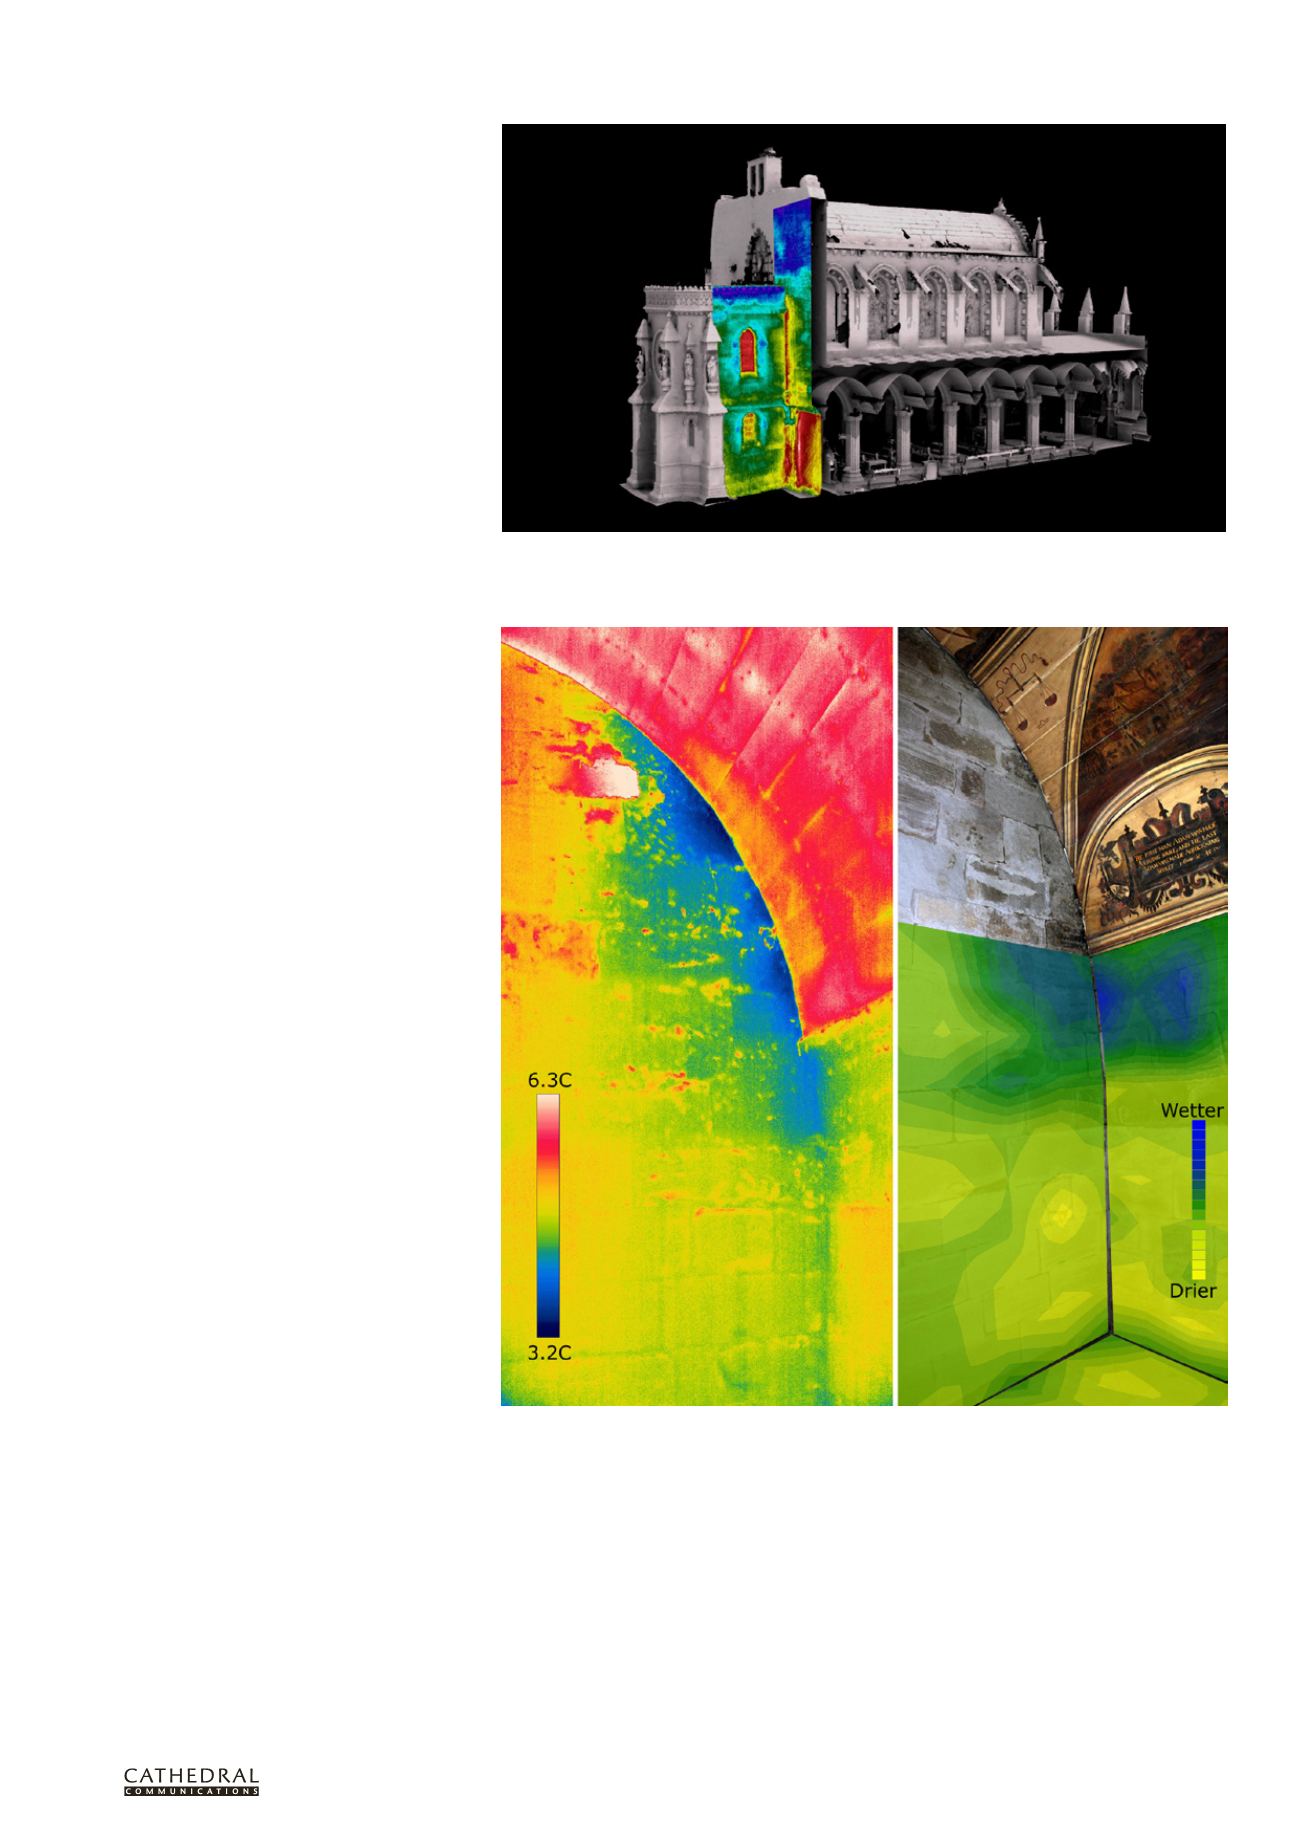
In some situations thermal imaging
can also be usefully combined with 3D laser
scanning to produce 3D thermal images. This
is particularly useful in complex buildings
where the relationship between different parts
of the structure may be difficult to visualise.
For example, tracing water leaks through a
complex structure to determine the source of
ingress may be easier if the thermal data can be
visualised in three dimensions.
A thermal image should not be taken at
face value. The diagnosis should always be
confirmed by further inspection.
Recommended Reading
BINDT, Infrared Thermography Handbook
Vol 1: Principles and Practice, 2004
BINDT, Infrared Thermography Handbook
Vol 2: Applications, 2004
BS EN 13187:1999, Thermal performance of
buildings. Qualitative detection of thermal
irregularities in building envelopes.
Infrared method
FLIR, Infrared guidebook for building
applications, 2009
This image combines 3D laser scanning with thermal imaging to produce a 3D thermogram. Air leakage at the
junction between the original 16th-century structure and a Victorian addition is the cause of significant heat
loss. High heat loss is also observed on the thin stonework at the end of the aisle. The thickness of the stone wall
at this point would not have been easily observed without access to 3D scan data.
Evaporation of moisture from this masonry wall is the cause of cooler patches in the thermal image (left).
Concentrations of moisture below the surface (right) were confirmed using a microwave moisture sensor which
is able to detect moisture at depths up to 20–30cm.
FLIR, Thermal imaging guidebook for building
and renewable energy applications, 2011
M Vollmer and KP Möllmann, Infrared
Thermal Imaging: Fundamentals,
Research and Applications, Wiley-VCH,
Germany, 2010
T Ward, Information Paper IP1/06, Assessing
the effects of thermal bridging at junctions
and around openings, 2006
BSc(Hons) MSc PhD is a
conservation scientist with a background
in geology. She joined Historic Scotland in
2007 and is a trained thermographer (ITC
Level 1). She has been involved in built
environment scientific research since 1989.


